Determining the ROI from Remote Patient Monitoring: A Primer
Remote patient monitoring (RPM) refers to a variety of high tech and high touch patient care approaches that do not require a face-to-face visit. RPM solutions promote better health at lower costs because they enable more frequent health status monitoring and feedback, make home
the central place of care, serve as an early warning system of deteriorating health, enable early intervention, and, as a result, typically reduce emergency room visits and hospitalizations.
Before investing in an RPM program, organizations naturally seek to understand their potential return on investment (ROI). This document is intended to serve as a brief guide to the factors that should be considered in such an analysis. This is presented through the hypothetical example of an organization seeking to create a care management program for individuals with congestive heart failure (CHF) who will be engaged for at least six months, if not longer.
Key Factors Detailed
The essence of an ROI model is that of a benefit-cost test. The following example examines benefits
to costs on a PPPY basis (per patient, per year). Organizations may also want to calculate ROI
based on their total expected patient volume/enrollment.
Benefits. The benefit of an RPM-based program will be a function of the projected reduction of the average cost of a given population. For this example, we assume that the organization applies the selection algorithm to a data set and draws a population with an average projected cost of $20,000 per year. Based on a literature search, the organization decides that a 20 percent gross reduction in annual costs is feasible. The gross per-patient savings – or benefit – is thus $4,000 per year.
Costs.The two key categories of cost are labor costs and technology.
Labor costs are a function of the costs of paying staff and their caseloads.
Staff costs will differ in different areas and between different organizations based on multiple factors such as level of credential, relative area labor costs (such as New York City vs. Poughkeepsie), and whether a workforce is unionized. This later factor may also have an impact on caseloads.
Caseloads will be a function of the acuity level of a managed population, and workflow, which in turn will be heavily influenced by the RPM intervention being used. Staffing requirements can be treated as fixed project-based overhead or as a variable cost.

Fall
For the purposes of our example, the organization implementing the hypothetical program is in the Midwest, where area costs are at about the national average – and the average fully loaded staff cost is $100,000. Furthermore, the organization’s selection algorithm is tied to identifying
patients who have had at least two hospitalizations in the previous year. Given the nature of the CHF population and technology selected, our example assumes that a care manager can support 200 individuals (which achieves the desired cost reduction). The average labor cost per patient thus is
$50 per month, or $600 per year. Implementing an RPM program often necessitates the creation of new job functions or roles that may not have existed before. ROI models may incorporate new labor costs that are incurred for this reason.
2 0 1 1 Center for Technology and Aging Affiliated with the Public Health Institute Supported by a grant from The SCAN Foundation
Technology costs will vary between vendors and their value propositions. Many RPM solutions include dedicated base stations (which can ask questions for daily assessments via text or audio), with optional peripheral medical devices that vary based on condition for monitoring biometrics such as weight and blood pressure. For the purposes of our example CHF population, the organization chooses a vendor
that markets a base station, and also chooses to have a connected weight scale and blood pressure cuff for each patient. The vendor also charges fees for telecommunications and application services. These charges add up to another $50 per patient per month or $600 per year.
There are other costs surrounding implementation and ongoing operations. These costs include:
• Developing a program design and clinical protocols
• Training staff
• Outreach to patients to engage them in the program
• Outreach to physicians and other providers who will support patients in the program
• The cost of getting hardware to a patient, installing it, and training the patient in using it
• The cost of retrieving the hardware when a patient dis-enrolls
For the purposes of our example, these costs – some amortized one-time costs, others recurring costs –
add up to an additional $20 per month, or $240 per year.
Technology costs may also vary depending upon a rental or purchase contract. For example, if purchasing equipment, there may be costs associated with maintenance, inventory management, and software licensing. If renting equipment, there may be costs associated with refurbishing and shipping/ handling.
What’s the ROI?
For the purposes of this example, the gross benefit of the intervention is $4,000 per patient per year. The gross cost is $1,440. This would imply an ROI of 278 percent, meaning, $2.78 would be returned for every dollar invested in the program. Seeing that the program still would produce a positive ROI
even if the gross cost reduction were only half that of the 20 percent used in the analysis – or an ROI of
139 percent – the organization decides to implement a telehealth-based care-management program.
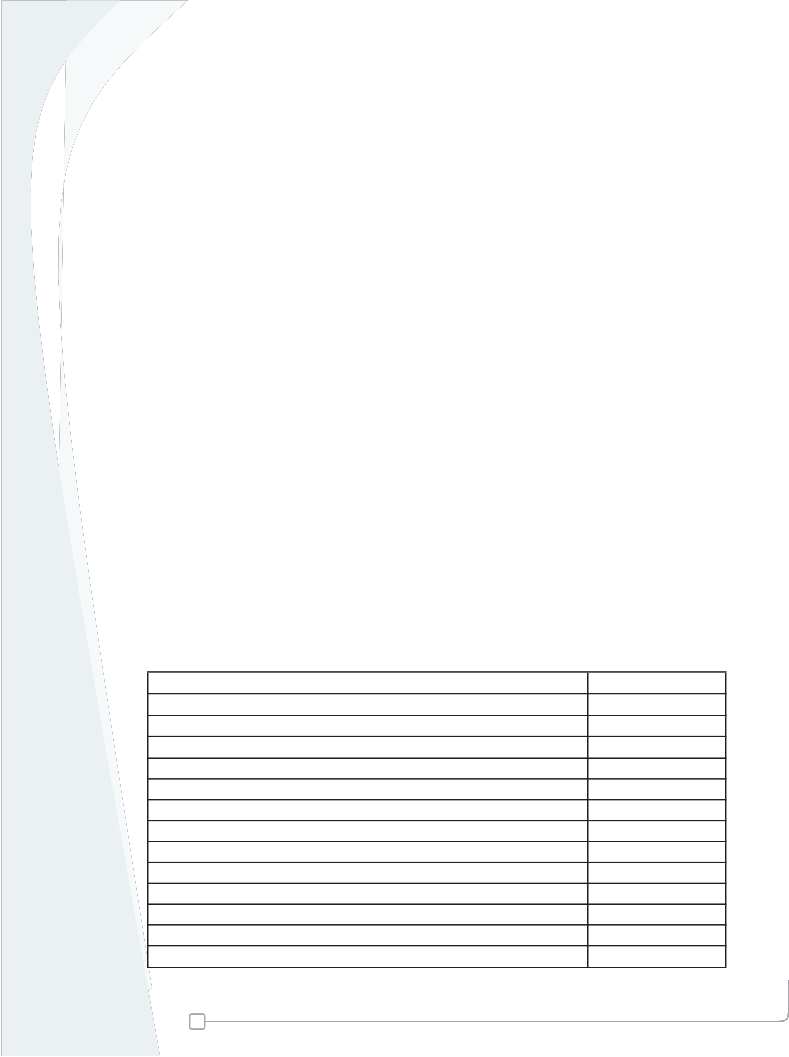
ROI Model Example
Benefits of RPM Program
Average per patient per year (PPPY) healthcare costs $20,000
Estimated gross savings percentage 20%
Estimated PPPY gross savings $4,000
Costs of RPM Program
Average labor cost PPPY $600
Average technology cost PPPY $600
Amortized implementation costs and other operating costs $240
Total cost PPPY $1,440
PPPY net savings $2,560
ROI 278%

Remote Patient Monitoring Diffusion Grants Program
2
Center for Technology and Aging
Affiliated with the Public Health Institute
Supported by a grant from The SCAN Foundation
Evaluating the ROI from RPM-based programs isn’t really different from evaluating the ROI of any
care-management intervention. The major difference is the incremental benefit of the technology from improved outcomes and caseloads and the incremental cost of the technology. An organization thus may seek to model ROI by comparing three different care-management paradigms:
1. The existing standard of care, which typically involves minimal support for an individual with chronic illness.
2. Traditional care- and case-management, which is almost strictly based on human-to-human contact via the telephone and home visits.
3. RPM-based care management, which is typically rooted in an “exception-based” model of care in which staff focuses on patients who, based on RPM-based daily assessments, need help that day, which in turn would result in higher caseloads.
The Center for Technology and Aging ROI of RPM Initiative
The Center for Technology and Aging (CTA), with funding from the California HealthCare Foundation, is
evaluating the ROI of five RPM programs.
Program collaborators include:
• Center for Connected Health at Partners Healthcare
• Centura Health at Home
• Dignity Health
• Healthcare Partners Institute for Applied Research and Education
• Sharp HealthCare Foundation
• Veterans Administration Central California Health Care System
The Center for Technology and Aging (techandaging.org) is the national resource for expertise in
the use of patient-centered technologies for older adults. CTA supports the adoption and diffusion of technology-enabled care that is patient-centered, coordinated, efficient and effective. CTA is focused on four areas of opportunity that can transform lives: medication optimization, remote patient monitoring, care transitions, and mobile health. Established with funding from The SCAN Foundation (www. thescanfoundation.org), CTA is affiliated with the Public Health Institute (www.phi.org) in Oakland, CA.

Remote Patient Monitoring Diffusion Grants Program
3
Center for Technology and Aging
Affiliated with the Public Health Institute
Supported by a grant from The SCAN Foundation


