Page 4 Case Studies in Telehealth Adoption Centura Heal that Home Telehealth as the Standard of Care
P. 4
www.himss.org FALL 2013 VoLume 27 / NumBeR 4 31
n
n
F
focus: titleoCuS: 30 DAyS To MAke A DiFFerenCe
feelings of empowerment to manage their
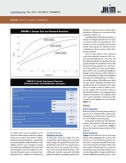
Figure 1: Sample Size and Standard Deviation. condition, willingness to recommend the
program to others, etc.
Analyzing the change from baseline, a
simple one sample paired t-test was used
to analyze statistical significance. The
results were to be reported with a p value
which will indicate the likelihood that
variations are due to chance rather than
the intervention.
Data for this project were analyzed
using the statistical software, SAS, ver-
sion 9.3 (SAS Institute Inc., Cary, NC). For
blood pressure deduction analysis, the null
hypothesis (H0) was that there was no dif-
ference between program user and non-
user. The paired t-test was used to deter-
mine if there was a statistically significant
change in blood pressure (after-before). It
was expected that 30 subjects would afford
80.5 percent statistical power to detect a
Table 2: Study Participant Baseline 7.4 mmHg average of the differences after
Characteristics and Medication Changes. 30 days, with a standard deviation of 10
mmHg. Bivariate comparisons were made
using chi-square tests for patient satis-
faction analysis. The reduction in time to
the clinical decision was compared using
analyses of covariance. Two-sided p values
were used for all other comparisons. The
a priori level of significance was 0.05 (See
Figure 1).
RESuLtS
Study Population
Between October 2012 and January 2013, 34
patients were enrolled in the study group.
Demographic and risk-factor characteris-
tics were similar across the group.
All enrolled patients met the eligibility
criteria. The majority of the patients were
on three or more medications. Table 2
shows the baseline characteristics of the
patients.
the study, and a nurse practitioner in the the nurse manager. Primary Outcome
physician offices made medication adjust- Statistical Analysis Figure 2 indicates the clinical outcomes
ments as necessary. One author—both a In this pilot study, the single arm self- for the study population after 37 days. The
biostatistician and physician—established control (each observation acts as a control) P-values of <0.001 for the decreases in sys-
the study methods, worked with the cardi- study design was applied. The study com- tolic and =0.0053 for diastolic blood pres-
ologists and the nurse manager to design pared those who used the program for 30 sures indicate that the results are due to the
the study, and established alert levels and days (and up to an average of 37 days) to intervention. Monitoring was continued
associated protocols. The registered nurse their own baseline blood pressure. The past 30 days (approximately 5 weeks). Over
executed the post-survey and patient sat- additional variable measured included 4 weeks, the patients’ average systolic blood
isfaction survey, which were analyzed by patient feedback regarding satisfaction, pressure (SBP) decreased from 155.9 +/- 18.0