Page 5 CirculationCardiovascularQualityandOutcomes
P. 5
4 Circ Cardiovasc Qual Outcomes March 2013
and in the full cohort model, an indicator for DM/CKD. For analy- relatively low in this study (6.3%), and the results were comparable
ses of BP control, similar models could not be estimated because at in complete case analyses.
baseline all study subjects were not in control. We instead used mul-
tiple imputations to estimate BP control for the 22 people missing this
outcome. Imputation models included the covariates listed above and Results
variables for baseline SBP and DBP. Missing data were monotonic, Figure 1 shows the flow of patients through the initial screen-
and we used the logistic option of Proc MI (SAS 9.2) to produce 10 ing, baseline visit, randomization, and 6-month follow-up
imputations. BP control was analyzed through the use of binomial phases of the study. Of 348 patients enrolled in the study, 326
models and generalized estimating equation methods to account for (94%) completed the 6-month visit (162 in the HBPM group;
repeated subjects per clinic. We completed models for each imputed 164 in the UC group). The median time to follow-up was 182
data set and combined results with Proc MIanalyze. Adjusted BP con-
trol outcome models controlled for age, sex, race, baseline BP, and in days for both groups. There were no significant differences
the full cohort model, an indicator for DM/CKD. Missing data were in the demographic and clinical characteristics of those who
completed the 6-month visit and those who did not.
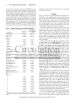
The study population had a mean age of 60 years; 40%
Table 1. Baseline Characteristics of the Study Population
were female and 83% were white. Nearly half of these
Home Blood patients (49%) had DM and CKD. There were no statisti-
Usual Care Pressure Monitoring cally significant differences in baseline demographic and
Characteristics (n=173) (n=175) clinical characteristics of the HBPM and the UC patients
Mean age (SD), y 59.1 (10.9) 60.0 (11.3) (Table 1). However, there was a trend toward a higher mean
Male, n (%) 102 (59.0) 108 (61.7) baseline BP for the HBPM group compared with the UC
Race, n (%) group (148.8 versus 145.5 mm Hg for SBP; 89.6 versus 88.0
White 146 (84.4) 143 (81.7) mm Hg for DBP).
Black 14 (8.1) 15 (8.6) After 6 months, the mean BPs were significantly lower in
Asian 1 (0.6) 5 (2.9) the HBPM group than in the UC group (128.1 versus 137.4
mm Hg, P<0.001 for SBP; 79.1 versus 83.1 mm Hg, P<0.01
Other 12 (6.9) 12 (6.9) for DBP). The proportion of patients achieving BP goal at 6
Ethnicity, n (%) months was significantly higher in the HBPM group (54.1%)
Hispanic 10 (5.8) 16 (9.1) than in the UC group (35.4% adjusted risk ratio, 1.5; 95%
Current smoking, n (%) 13 (7.5) 17 (9.7) confidence interval [CI], 1.2–1.9; Figure 2). In the subset of
Diabetes mellitus or chronic kidney 88 (50.9) 81 (46.3) patients with DM and CKD, the proportion of patients achiev-
disease, n (%) ing BP goal was also higher in the HBPM group (51.7% versus
Systolic blood pressure, mean 145.5 (14.5) 148.8 (16.2) 21.9%; adjusted risk ratio, 2.5; 95% CI, 1.6–3.8; Figure 2).
(SD), mm Hg Average SBP and DBP decreased significantly in both
Diastolic blood pressure, mean 88.0 (9.9) 89.6 (10.2) groups over the study period (Figure 3). Compared with
(SD), mm Hg the UC group, the HBPM group experienced a 12.4-mm Hg
No medication, n (%) 19 (11.0) 24 (13.7) larger drop in SBP (95% CI, −16.3 to −8.6) and a 5.7-mm Hg
Thiazide diuretic, n (%) 70 (40.5) 81 (46.3) larger drop in DBP (95% CI, −7.8 to −3.6). The impact of the
ACE inhibitor/ARB, n (%) 109 (63.0) 104 (59.4) intervention on BP lowering was even greater in the subset of
β-Blocker, n (%) 53 (30.6) 43 (24.6) patients with DM and CKD. Within this cohort, the HBPM
Calcium channel blocker, n (%) 33 (19.1) 32 (18.3) group experienced a 15.4-mm Hg larger drop in SBP (95% CI,
Other, n (%) 17 (9.8) 15 (8.6) −21.0 to −9.8) and a 7.3-mm Hg larger drop in DBP (95% CI,
−10.4 to −4.1).
Medications, mean (SD), n 1.6 (0.8) 1.6 (0.7) Of the 326 patients who completed the 6-month visit, more
Medication intensity score, mean 2.7 (1.9) 2.7 (1.8) HBPM patients had an antihypertensive medication added to
(SD) their regimen than UC patients (113 [70%] versus 41 [25%];
Clinic, n (%) P<0.001; Table 2). Similarly, a greater number of HBPM
1 9 (5.2) 12 (6.9) patients had the dose increased for an existing antihyperten-
2 11 (6.4) 9 (5.1) sive medication (69 [43%] versus 20 [12%] in the UC group;
3 29 (16.8) 27 (15.4) P<0.001). Overall, 120 of the 147 HBPM patients (82%)
4 27 (15.6) 24 (13.7) using prescription antihypertensive medications and 115 of
5 21 (12.1) 23 (13.1) the 158 UC patients (73%) purchased their antihypertensive
6 1 (0.6) 12 (6.9) medications exclusively at KPCO pharmacies during the
7 20 (11.6) 19 (10.9) study period. Among this group, there was no difference in
the mean medication possession ratio adherence score over
8 21 (12.1) 19 (10.9) the 6-month study period (0.86 versus 0.87; P=0.93).
9 24 (13.9) 16 (9.1) The proportion of patients at 6 months reporting that they
10 10 (5.8) 14 (8.0) were very or completely satisfied with their hypertension
ACE indicates angiotensin-converting enzyme; and ARB, angiotensin receptor care was significantly higher in the HBPM group (58%)
blocker. than in the UC group (42%; P<0.001). More patients in
Downloaded from circoutcomes.ahajournals.org by guest on March 20, 2013