Page 6 Cost effectiveness of telehealth for patients with long term conditions WSD telehealth study
P. 6
BMJ 2013;346:f2065 doi: 10.1136/bmj.f2065 (Published 28 March 2013) Page 6 of 6
CORRECTIONS
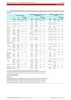
Table 4| [CORRECTED VERSION] Baseline characteristics of participants with available baseline economic data, at baseline and 12 month
follow-up
Participants completing 12 month follow-up Participants not completing 12 month
Total baseline sample study instruments follow-up
Difference Difference Difference
UC TH Stand UC TH Stand UC TH Stand
(n=728) (n=841) Raw (£) (%)* (n=431) (n=534) Raw (£) (%)* (n=297) (n=302) Raw (£) (%)*
Age (years) 70.6 (11.8) 70.1 (11.8) −0.46 −4.0 70.1 70.0 −0.12 −1.1 71.3 70.5 −0.78 −6.1
(11.66) (10.71) (11.93) (13.48)
Women (%) 40 (n=290) 41 (n=347) 1.4 2.9 37.6 41.6 3.9 8.1 43 (n=128) 41 (n=124) −2.0 −4.1
(n=162) (n=222)
IMD 28.6 (13.8) 27.7 (15) −0.87 −6.0 27.7 26.1 (14.3) −1.60 −12.0 29.8 30.6 0.72 4.9
(score)§¶ (13.65) (13.91) (15.75)
Group 1 17.9 25.6 7.7‡ 18.4 18.9 (n=81) 28.2 9.1‡ 21.9 16.5 (n=49) 21.2 (n=64) 4.7 12.0
(%)§ (n=130) (n=215) (n=151)
Group 2 22.7 16.8 −5.8‡ −14.7 24.5 17.6 (n=94) −6.8‡ −16.9 19.9 (n=59) 15.2 (n=46) −4.6 −12.2
(%)§ (n=165) (n=141) (n=106)
Group 3 17 (n=124) 18.4 1.4 3.7 18.4 (n=79) 19 (n=101) 0.6 1.5 15.2 (n=45) 17.5 (n=53) 2.4 6.5
(%)§ (n=155)
Group 4 23.1 19.5 −3.7 −8.8 20.2 (n=87) 20.4 0.1 0.5 27.3 (n=81) 17.9 (n=54) −9.4‡ −22.5
(%)§ (n=168) (n=164) (n=109)
Group 5 19.4 19.7 0.4 0.9 18.1 (n=78) 14.8 (n=79) −3.3 −8.9 21.2 (n=63) 28.1 (n=85) 6.9† 16.1
(%)§** (n=141) (n=166)
Index condition (%)
COPD 33.5 39.7 6.1† 12.8 32.5 43.4 11.1‡ 22.5 35 (n=104) 32.8 (n=99) −2.2 −4.7
(n=244) (n=334) (n=140) (n=232)
Heart failure 37.8 31.3 −6.5‡ −13.7 40.6 33.1 −7.8† −15.5 33.7 28.5 (n=86) −5.2 −11.2
(n=275) (n=263) (n=175) (n=177) (n=100)
Diabetes†† 28.7 29 (n=244) −0.3 0.7 26.9 23.4 −3.4 −8.1 31.3 (n=93) 38.7 7.4 15.6
(n=209) (n=116) (n=125) (n=117)
No of 2 1.8 −0.18 −9.7 2 1.8 −0.22 −12.0 2.1 2 −0.09 −4.9
comorbidities (1.9) (1.8) (1.9) (1.8) (1.8) (1.8)
Baseline 1276 1244 −32 −1.9 1096 1172 92 5.0 1536 1341 −195 −10.7
costs (£) (1628) (1687) (1408) (1620) (1875) (1751)
WSD site (%)
Site 1 32.1 30.4 −1.7 30.6 32.6 1.8 4.2 34.3 26.8 (n=81) −7.5† −16.3
(n=234) (n=256) −1.9 (n=132) (n=174) (n=102)
Site 2 38.9 40.7 1.8 42.7 44.2 1.3 3.0 33.3 (n=99) 34.8 1.4 3.0
(n=283) (n=342) 2.0 (n=184) (n=236) (n=105)
Site 3‡‡ 29 (n=211) 28.9 −0.2 −0.2 26.7 23.2 −3.1 -8.0 32.3 (n=96) 38.4 6.1 12.7
(n=243) (n=115) (n=124) (n=116)
White British 86.3 86.9 0.6 1.7 87.5 89.5 2.0 6.4 84.5 82.9 −1.6 −4.3
ethnicity (%)§ (n=628) (n=731) (n=377) (n=478) (n=251) (n=250)
£1=€1.14; $1.49. Data are mean (standard deviation) or proportion (%) and no of patients.
UC=usual care; TH=telehealth; Stand=standardised difference; COPD=chronic obstructive pulmonary disease.
*Standardised difference=difference between group means divided by standard deviation of the total sample.
†P<0.05 on z test of proportions.
‡P<0.01 on z test of proportions.
§Imputed data.
¶Difference between means of TH group sample at baseline and 12 month follow-up: P<0.05, t=2.09 (unpaired t test).
**Difference between proportions of patients in TH group at baseline and 12 month follow-up: z=2.34, P<0.05.
††Difference between proportions of patients in TH group at baseline and 12 month follow-up: z=2.29, P<0.05.
‡‡Difference between proportions of patients in TH group at baseline and 12 month follow-up: z=2.32, P<0.05.
For personal use only: See rights and reprints http://www.bmj.com/permissions Subscribe: http://www.bmj.com/subscribe
CORRECTIONS
Table 4| [CORRECTED VERSION] Baseline characteristics of participants with available baseline economic data, at baseline and 12 month
follow-up
Participants completing 12 month follow-up Participants not completing 12 month
Total baseline sample study instruments follow-up
Difference Difference Difference
UC TH Stand UC TH Stand UC TH Stand
(n=728) (n=841) Raw (£) (%)* (n=431) (n=534) Raw (£) (%)* (n=297) (n=302) Raw (£) (%)*
Age (years) 70.6 (11.8) 70.1 (11.8) −0.46 −4.0 70.1 70.0 −0.12 −1.1 71.3 70.5 −0.78 −6.1
(11.66) (10.71) (11.93) (13.48)
Women (%) 40 (n=290) 41 (n=347) 1.4 2.9 37.6 41.6 3.9 8.1 43 (n=128) 41 (n=124) −2.0 −4.1
(n=162) (n=222)
IMD 28.6 (13.8) 27.7 (15) −0.87 −6.0 27.7 26.1 (14.3) −1.60 −12.0 29.8 30.6 0.72 4.9
(score)§¶ (13.65) (13.91) (15.75)
Group 1 17.9 25.6 7.7‡ 18.4 18.9 (n=81) 28.2 9.1‡ 21.9 16.5 (n=49) 21.2 (n=64) 4.7 12.0
(%)§ (n=130) (n=215) (n=151)
Group 2 22.7 16.8 −5.8‡ −14.7 24.5 17.6 (n=94) −6.8‡ −16.9 19.9 (n=59) 15.2 (n=46) −4.6 −12.2
(%)§ (n=165) (n=141) (n=106)
Group 3 17 (n=124) 18.4 1.4 3.7 18.4 (n=79) 19 (n=101) 0.6 1.5 15.2 (n=45) 17.5 (n=53) 2.4 6.5
(%)§ (n=155)
Group 4 23.1 19.5 −3.7 −8.8 20.2 (n=87) 20.4 0.1 0.5 27.3 (n=81) 17.9 (n=54) −9.4‡ −22.5
(%)§ (n=168) (n=164) (n=109)
Group 5 19.4 19.7 0.4 0.9 18.1 (n=78) 14.8 (n=79) −3.3 −8.9 21.2 (n=63) 28.1 (n=85) 6.9† 16.1
(%)§** (n=141) (n=166)
Index condition (%)
COPD 33.5 39.7 6.1† 12.8 32.5 43.4 11.1‡ 22.5 35 (n=104) 32.8 (n=99) −2.2 −4.7
(n=244) (n=334) (n=140) (n=232)
Heart failure 37.8 31.3 −6.5‡ −13.7 40.6 33.1 −7.8† −15.5 33.7 28.5 (n=86) −5.2 −11.2
(n=275) (n=263) (n=175) (n=177) (n=100)
Diabetes†† 28.7 29 (n=244) −0.3 0.7 26.9 23.4 −3.4 −8.1 31.3 (n=93) 38.7 7.4 15.6
(n=209) (n=116) (n=125) (n=117)
No of 2 1.8 −0.18 −9.7 2 1.8 −0.22 −12.0 2.1 2 −0.09 −4.9
comorbidities (1.9) (1.8) (1.9) (1.8) (1.8) (1.8)
Baseline 1276 1244 −32 −1.9 1096 1172 92 5.0 1536 1341 −195 −10.7
costs (£) (1628) (1687) (1408) (1620) (1875) (1751)
WSD site (%)
Site 1 32.1 30.4 −1.7 30.6 32.6 1.8 4.2 34.3 26.8 (n=81) −7.5† −16.3
(n=234) (n=256) −1.9 (n=132) (n=174) (n=102)
Site 2 38.9 40.7 1.8 42.7 44.2 1.3 3.0 33.3 (n=99) 34.8 1.4 3.0
(n=283) (n=342) 2.0 (n=184) (n=236) (n=105)
Site 3‡‡ 29 (n=211) 28.9 −0.2 −0.2 26.7 23.2 −3.1 -8.0 32.3 (n=96) 38.4 6.1 12.7
(n=243) (n=115) (n=124) (n=116)
White British 86.3 86.9 0.6 1.7 87.5 89.5 2.0 6.4 84.5 82.9 −1.6 −4.3
ethnicity (%)§ (n=628) (n=731) (n=377) (n=478) (n=251) (n=250)
£1=€1.14; $1.49. Data are mean (standard deviation) or proportion (%) and no of patients.
UC=usual care; TH=telehealth; Stand=standardised difference; COPD=chronic obstructive pulmonary disease.
*Standardised difference=difference between group means divided by standard deviation of the total sample.
†P<0.05 on z test of proportions.
‡P<0.01 on z test of proportions.
§Imputed data.
¶Difference between means of TH group sample at baseline and 12 month follow-up: P<0.05, t=2.09 (unpaired t test).
**Difference between proportions of patients in TH group at baseline and 12 month follow-up: z=2.34, P<0.05.
††Difference between proportions of patients in TH group at baseline and 12 month follow-up: z=2.29, P<0.05.
‡‡Difference between proportions of patients in TH group at baseline and 12 month follow-up: z=2.32, P<0.05.
For personal use only: See rights and reprints http://www.bmj.com/permissions Subscribe: http://www.bmj.com/subscribe